Part 3 - How Calgary Police leadership cheated the census

Calgary Police Chief Mark Neufeld spun the 2022 CPS workplace census as evidence that CPS reflects the community.
But the census data tell the opposite story, revealing an impassable canyon between the demographics of Calgary Police and the city that pays their salaries.
An oft-repeated principle of policing is "police are the public and the public are the police." To serve this narrative, Calgary Police ran a workplace census in 2017 and 2022.
The census was gently promoted by Calgary Police through a 22-page report released around the 2023 Calgary Stampede, but CPS Commission made no public mention of it – and neither was it listed among Regular Commission Meeting agendas. As a result of this silence, local press ignored the 2022 census.
Calgary Police Commission's apparent disinterest in the report should have raised local eyebrows, given the Commission's alleged collusion in a cover-up related to religious neutrality within CPS leadership. The raw census data obtained by Drug Data Decoded through a freedom of information request confirm these suspicions.
So far in this series, we have seen that the Office of the Chief likely took intentional measures to hide its census data from the final report – for good reason. The obtained census data suggest a fortress mentality within the Office of the Chief, with new hires dominated by non-racialized people from outside the force, and a work-from-home culture that absorbs outsized overtime pay.
Part 3 will fact-check key demographic claims made in the report with the hard data shown in the spreadsheets. To view the Sworn Officer and Civilian Staff census responses for yourself, follow the links. Since we can't verify 2017 raw data, this analysis will only examine the 2022 data.
Claim: Fifteen percent of CPS members identify as racialized or person of colour.
FALSE: "Caucasian" and "Western European" should not figure into the "racialized" population.
Within that 15% "racialized" figure, 5% identify as Caucasian and 1% identify as Western European: these are not listed in the StatsCan census because "Caucasian" and "Western European" are the opposite of racialized. The CPS census report took no measure to correct this, other than noting that these categories are "self-identified" and taken from "open-ended responses."
CPS also did a neat thing in the census report. The small print notes that "15% of CPS identify as a Racialized person or a Person of colour. This is lower than Calgary's general population, where 49% of Calgarians identify as a visible minority [note: incorrect figure. Census data from 2021 show 39% of Calgarians are racialized.] However, the composition of Racialized groups identified by respondents is comparable to the Calgary demographic."
CPS is quietly acknowledging that racialized people are vastly underrepresented in comparison to Calgary's population, but they devote a large table to showing the percentage of the total racialized population represented by each racialized group and comparing this to Calgary. They buried the lede.
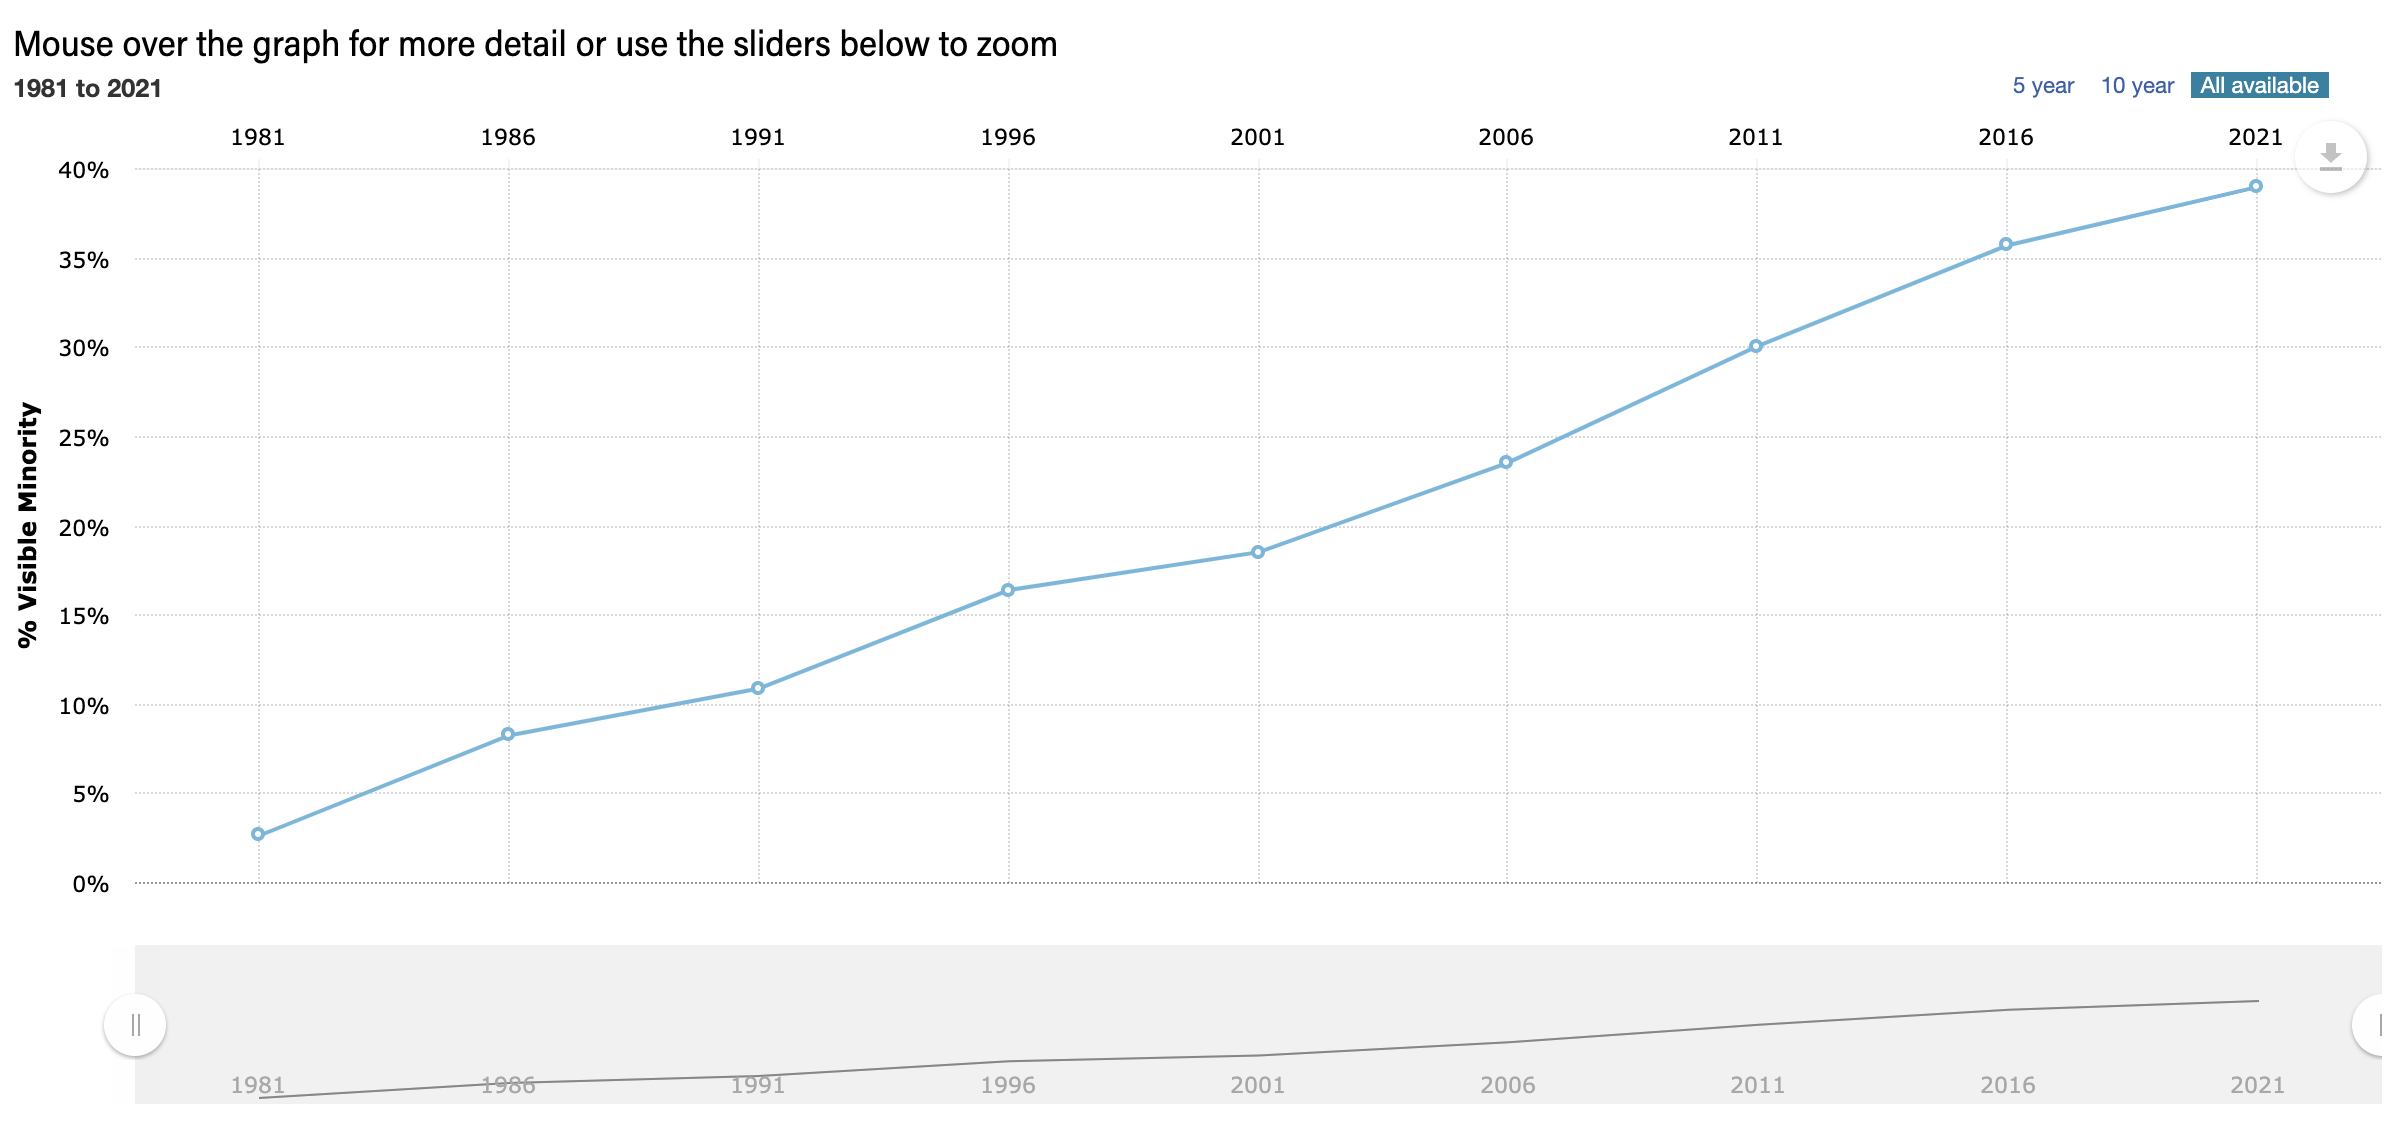
The census data for Calgary going back to 1981 show that the current racialized makeup of CPS roughly reflects the population of Calgary in 1991.
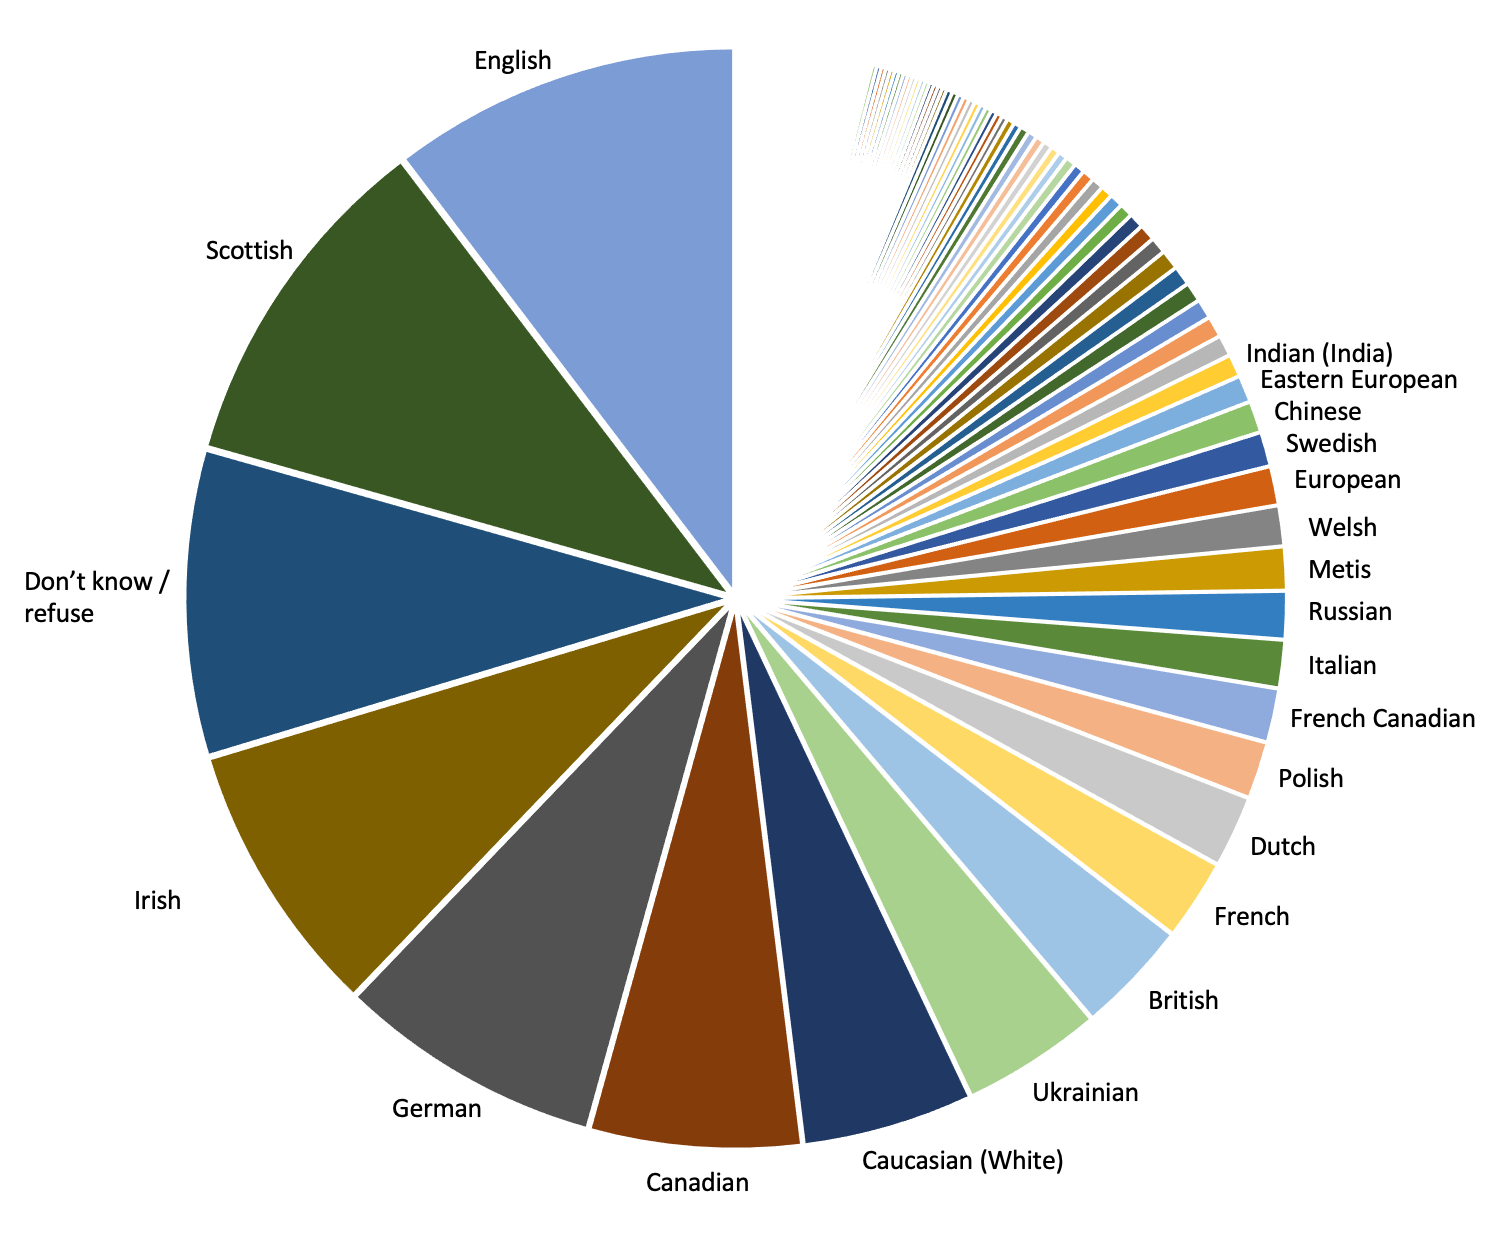
Among officers, we have to travel 3/4 of the way around the pie chart to finally arrive at the largest non-European racialized ethnic group in CPS – Metis, making up around 2% of officers. Embarrassingly, CPS had to distinguish "Indian (India)" among its responses.
Claim: The religious composition of CPS is proportional to the religious composition of Calgary's general population.
FALSE: CPS members have considerably lower overall religiosity and representation by Muslim, Sikh and Indigenous Spirituality than Calgary's population.
This section is another clear attempt to muddy the water. It is worth examining the table as it is presented in the CPS census report.
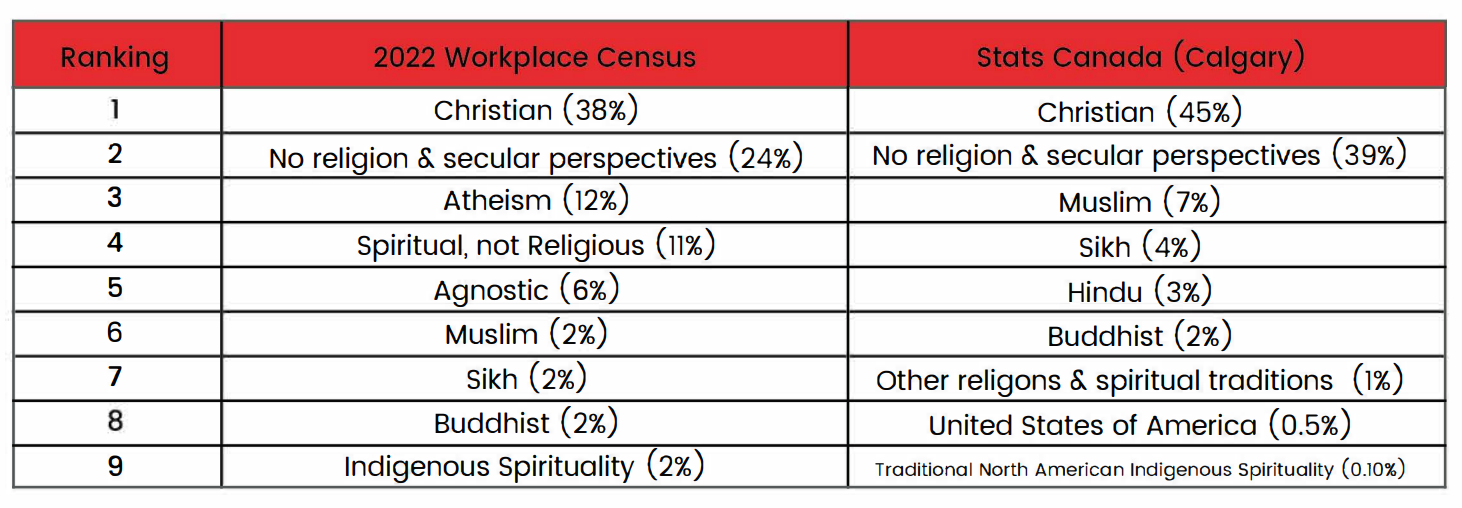
Ranking #2 shows "No religion and secular perspectives." However, CPS exempts "Atheism," "Spiritual, not Religious," and "Agnostic" from that total, presenting them separately. This is not how Stats Canada conducts its census, even though Calgary Police census is clearly modelled after the federal one.
Adding these non-religious responses together enables comparison with the Stats Canada census data for Calgary. For CPS the true total responding "No religion and secular perspectives" is not 24% – it is 53%. This is considerably higher than Calgary's demographic figure of 39% responding "No religion and secular perspectives."
Sworn officers provided even higher non-religious responses, with 52 to 60% of officers from all bureaus including the Office of the Chief responding "No religion and secular perspectives."
Among its membership, CPS underrepresents followers of Muslim, Sikh, Hindu and Indigenous Spirituality by up to 4-fold in comparison with the Calgary population. Meanwhile, CPS inexplicably ranked "United States of America" as #8 under the Stats Canada data, at 0.5% of the population. Based on the Calgary census, this was likely meant to be "Jewish," which makes up around 0.5% of the Calgary population.
The claim that "the religious composition of CPS is relatively proportional to the religious composition of the general population" is a fabrication. Undoubtedly infuriating to many, Calgary Police Commission approved the construction of a church near the front entrance of Calgary Police headquarters in 2018. The church is now quietly being dismantled and its components stripped away, including the pews that were reportedly imported from Ireland.
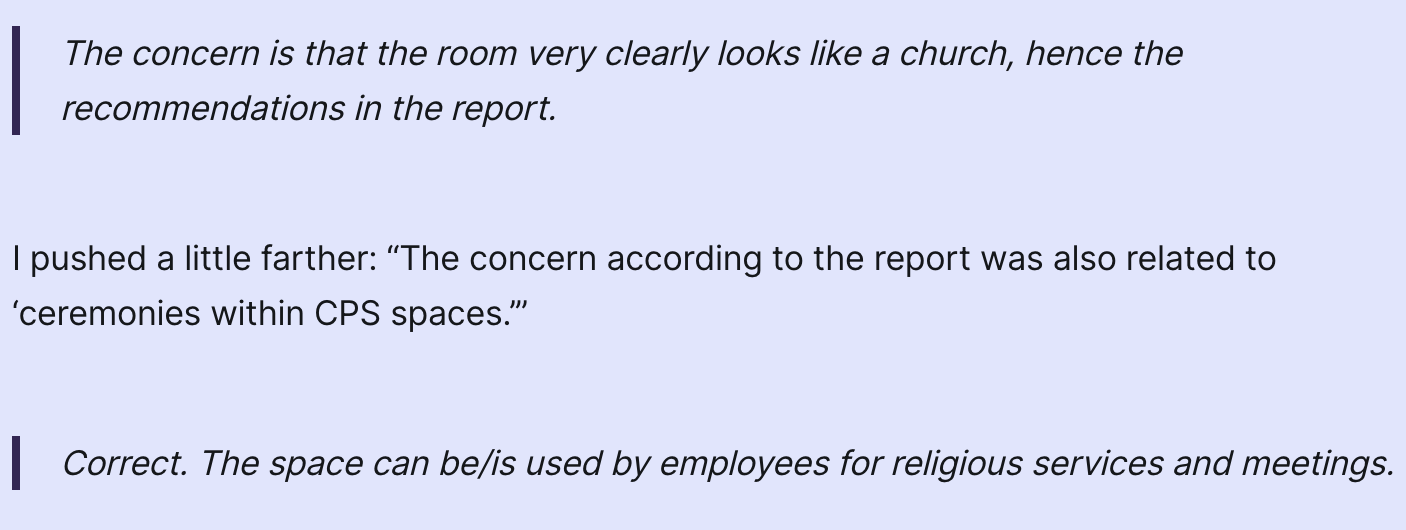
A laundry list of questionable decisions from the top ranks of CPS and its oversight commission raise serious questions about whether the Service broke human rights law on religious neutrality. These were tabulated by a board member of Rocky Mountain Atheists, who are still awaiting a response from Calgary Police Commission.
No wonder there's trouble in the ranks at CPS: the majority of it members have been reminded every time they walk into headquarters that they don't belong in their own workplace.
Claim: Proportion of male-identifying staff has decreased to 57% in 2022.
TRUE.
But this masks the fact that 71% of police officers still identify as men.
| Officer % | Civilian % | Total % | |
| Woman | 22.5 | 67.0 | 37.2 |
| Man | 70.7 | 28.6 | 56.8 |
| Two-Spirit | 0.8 | 0.2 | 0.6 |
| Transgender person | 0.5 | 0.4 | 0.5 |
| Genderqueer/gender non-conforming | 1.0 | 0.2 | 0.8 |
| Non-binary | 0.8 | 0.5 | 0.7 |
| Gender identity not listed (please specify) | 0.3 | 0.0 | 0.2 |
| I prefer not to answer | 6.9 | 3.9 | 5.9 |
| NET: Other | 1.7 | 0.9 | 1.4 |
Claim: Proportion of diverse gender identities has increased to 5% in 2022.
FALSE: Gender-diverse people likely make up 1.7% of CPS respondents.
For this question, it seems that responses where people could select multiple answers were added together (i.e., the sum of categories: Two-Spirit, Genderqueer/nonconforming, Transgender, Non-binary, Gender identity not listed), artificially inflating the proportion of people with diverse gender identities. Diverse gender identities are higher among officers (1.7%) than civilian staff (0.9%).
These statistics show up in multiple places among the spreadsheets.
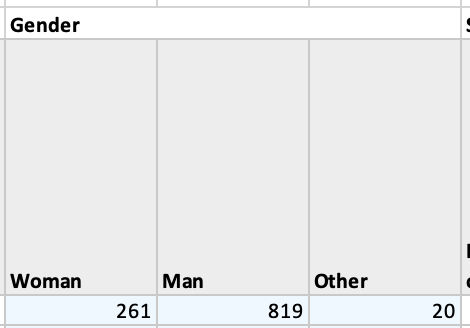
Yet, separately, over 10% responded "No" to the question "Do you identify as a cisgender person?" The question includes a clarifying definition: "The term 'cisgender' refers to people whose gender identity aligns with the biological sex they were assigned at birth."
The scientific literature suggests between 0.1 and 2% of people are gender-diverse or non-cisgender. It is possible that people misread the question, despite its definition, but for CPS members (including 14% of police officers) to self-identify as gender-diverse at this rate merits examination beyond the current scope.
Claim: Proportion of heterosexual staff has decreased to 86% in 2022.
TRUE.
It is unclear how the categories add up below for "Net", but combining "Heterosexual" with "I prefer not to answer" leaves 7% identifying as non-heterosexual, half of the 14% figure implied by the majority-centring headline.
| Officer % | Civilian % | Total % | |
| Heterosexual or straight | 87 | 85 | 86 |
| Gay | 2 | 2 | 2 |
| Lesbian | 3 | 2 | 2 |
| Bisexual | 2 | 3 | 2 |
| Two-spirit | 1 | 0 | 1 |
| Queer | 1 | 1 | 1 |
| Asexual | 0 | 1 | 1 |
| Pansexual | 1 | 1 | 1 |
| Sexual orientation not listed (please specify) | 0 | 0 | 0 |
| I prefer not to answer | 8 | 7 | 7 |
| NET: Other | 2 | 2 | 2 |
Want to dig into the data?
Start by accessing the Sworn Officer and Civilian Staff response spreadsheets, which were obtained through a freedom of information request from Calgary Police and are made freely available here.
The spreadsheets begin with TOC (table of contents), showing the list of questions. Each question is then answered through the lens of every other question, broken into three overarching 'banners': Banner 1, covering mainly workplace questions; Banner 2, covering personal, belief, racialization and language quesitons; and Banner 3, ethnic origin.
To extract the Office of the Chief data, head to the 'counts' tabs and scroll over to Primary Work Area. For any question, you can subtract the totals of the other four bureaus (Columns V through Y) from the Total answering the question (Column B). That yields the counts for each response from the Office of the Chief.
Hope you enjoyed Part 1, Part 2 and Part 3 of this series! It was a lot of work –consider subscribing below to make sure you don't miss critical drug prohibition research and analysis in easily understood form.
Drug Data Decoded provides analysis on topics concerning the war on drugs using news sources, publicly available data sets and freedom of information submissions, from which the author draws reasonable opinions. The author is not a journalist.

